Foreword: IPO Market and Capital Activity Overview
The third quarter of 2026 has been a defining period for India’s primary capital markets, marked by a remarkable divergence between the resilience of IPO activity and the weakness in the broader secondary market. Geopolitical tensions in West Asia, currency pressures, and elevated crude oil prices have weighed on market sentiment, yet India’s IPO market has continued to break records, demonstrating that investor appetite for public offerings remains resilient even amid broader market uncertainty.
Q3 2026 witnessed 63 IPO listings, the highest ever in a single quarter, with September alone recording 32 listings in a month and six listings in a single day. This surge was supported by a combination of factors, including timely regulatory relief from the Securities and Exchange Board of India (SEBI), which enabled companies with expiring offer documents to complete their listings, and a recalibration of IPO valuations and issue sizes to align with prevailing market realities. More than half of the companies that raised fresh capital reduced their proposed issue sizes, reflecting a greater willingness among issuers to prioritize market acceptance over earlier valuation expectations.
Importantly, the momentum extended beyond listing day. The average listing gain for Q3 stood at approximately 20%, while the average return since listing reached 36% as of 9 October 2026. This performance underscores the importance of realistic pricing and valuation discipline in shaping investor outcomes, with several recently listed companies continuing to deliver meaningful returns after their market debut.
The utilization of IPO proceeds also reveals a more measured approach to capital allocation. Debt repayment accounted for 48% of Q3 IPO proceeds, highlighting issuers’ focus on deleveraging, strengthening balance sheets and improving financial flexibility. Meanwhile, offer-for-sale transactions continued to account for a significant share of fundraising activity, at approximately 60% of total issue value, reinforcing the role of IPOs not only as a source of fresh capital but also as a route for existing shareholders to monetize their investments.
Despite the record number of listings, however, total issue value has not reached comparable highs. The quarter’s activity was characterized by a large number of relatively smaller offerings, with an average issue size of approximately INR 1,392 crore. With several sizeable offerings potentially entering the market in Q4 2026, the coming quarter could see a meaningful increase in capital raised, reminiscent of the strong fourth-quarter fundraising activity witnessed in 2024 and 2025.
In this edition, we examine the forces behind India’s IPO surge, the regulatory developments supporting listing activity, the recalibration of valuations and issue sizes, and the performance of companies following their market debut. We also explore how issuers are deploying capital and what the evolving mix of offerings signals about the maturity and direction of India’s capital markets.
As the year draws to a close, a strong pipeline of larger IPOs could further build on the record listing momentum of Q3, potentially making Q4 2026 another significant quarter for fundraising, supported by realistic valuations and sustained investor appetite. We hope this edition offers valuable insights into these developments and supports informed decision-making for issuers, investors, and other capital market participants.
India’s Capital Markets: A Tale of Two Markets
Record-breaking IPO activity amid secondary market weakness signals: A structural shift in India’s capital market landscape.
Indian capital markets are at an inflection point. In a rare divergence, the primary and secondary markets are moving in opposite directions, challenging the conventional relationship between IPO activity and broader market performance.
While the secondary market has remained under pressure amid geopolitical tensions in West Asia, currency depreciation, and elevated crude oil prices, India’s IPO market has continued to surge, delivering an unprecedented quarter of listing activity. With the Nifty 50 trading near the 22,500 mark (in early Oct 26), approximately 14% below its level in September 2024, the primary market has defied the broader market sentiment, setting new records across multiple parameters in September 2026 and the third quarter of the year:
6
Record listings in a single day, 17 September 2026
32
Record listings in a month, September 2026
63
Record listings in a quarter, Q3 2026
Beyond the record numbers, this divergence points to a potentially significant shift in the composition of India’s equity markets: a gradual broadening of market capitalization beyond the country’s largest listed companies. The concentration of market capitalization among the top 10 companies has declined from approximately 28% in December 2021 to below 18%, indicating a more distributed market-capitalization base.
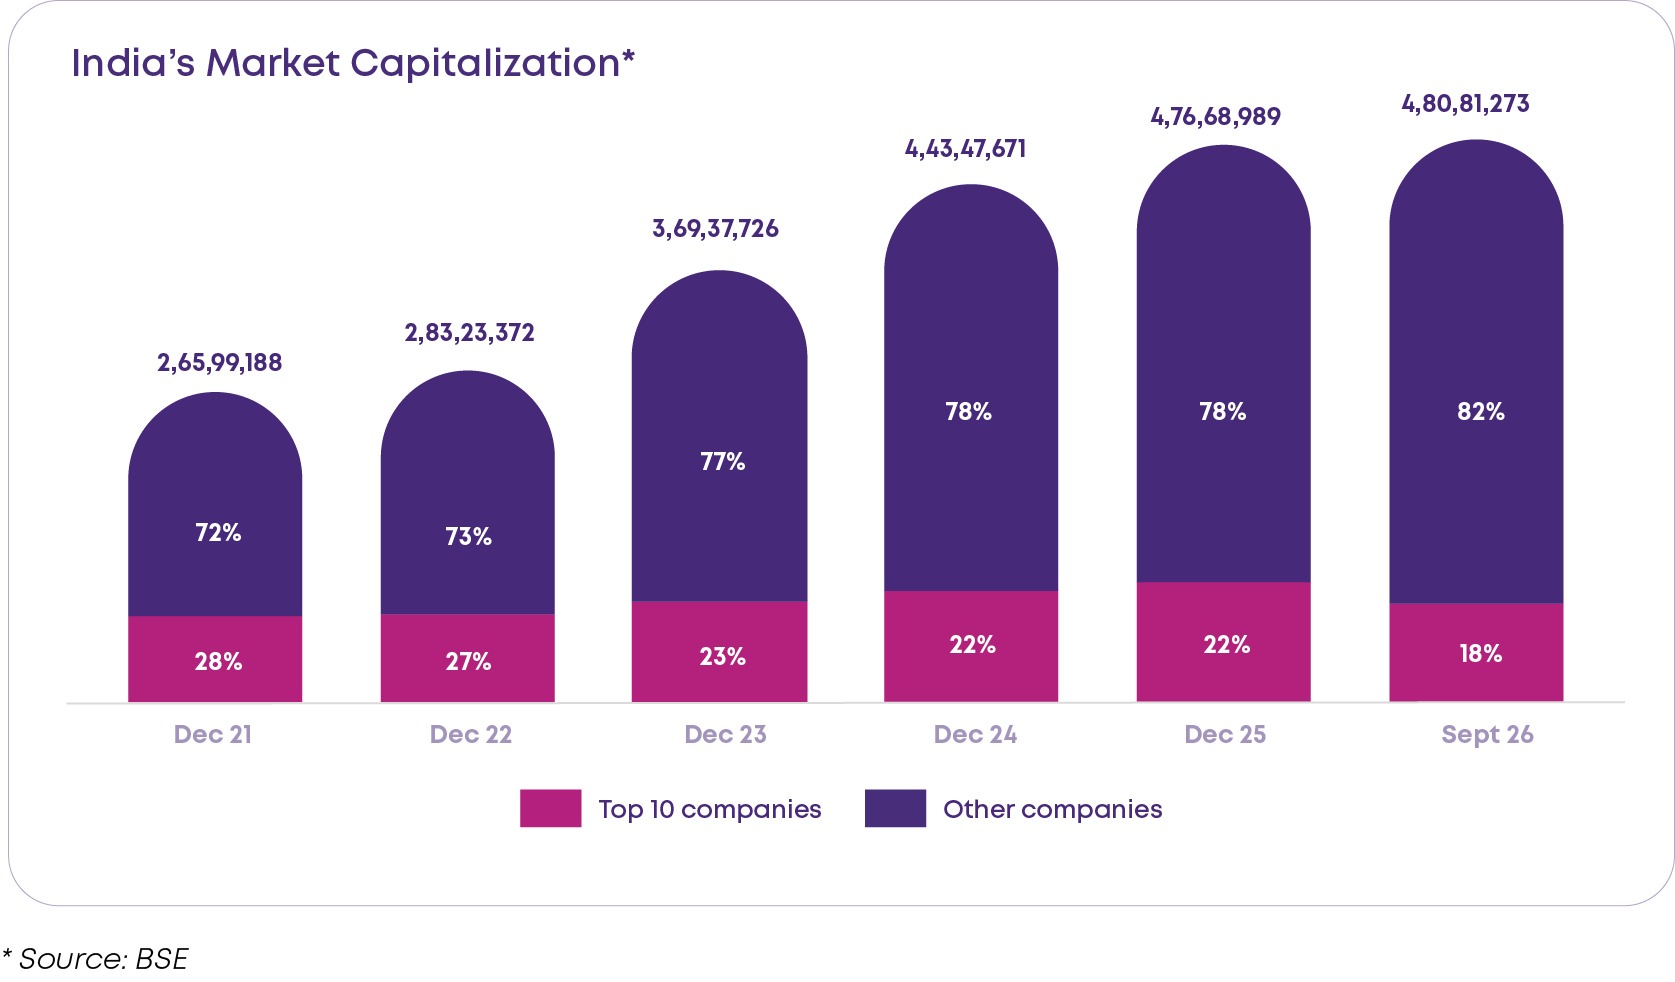
This shift is also reflected in the market’s performance in 2026. While India’s overall market capitalization has increased by only around ₹4 lakh crore, companies outside the top 10 have collectively added approximately ₹22 lakh crore in market value. This has been offset by a decline of nearly ₹18 lakh crore in the market capitalization of the top 10 companies, representing a reduction of approximately 17%.
The resilience of the broader market-capitalization base, despite weakness among the largest companies, highlights the growing contribution of businesses beyond the traditional market leaders. The continued addition of newly listed companies has been an important part of this evolution, expanding the universe of publicly traded businesses and broadening investor participation.
Is this divergence a temporary phase of exuberant primary-market activity, or a more enduring transformation?
Decoding the IPO Surge: What’s Driving the IPO Momentum
Building on the above, we delved deeper into the factors driving the surge in listing activity, examining the reasons behind the unprecedented volume of IPOs and how these companies have performed both on listing and in the post-listing period. Our analysis revealed a surprising trend that has played a significant role in sustaining the momentum in India’s primary market.
A
IPO Volume Surge: The Impact of SEBI’s One-Time Relief :
01
Disruption
Wars and market uncertainty in early 2026 stalled listings of companies that already held SEBI’s final observations on their Draft Red Herring Prospectuses (DRHPs).
02
One-time extension
SEBI let companies whose DRHPs expire between April and September 2026 list up to September 2026.
~14%
9 of the 63 listed companies benefited
Their offer documents would have expired without SEBI’s one-time exemption (DRHPs expiring April to September 2026).
This intervention highlights SEBI’s pragmatic approach to balancing regulatory discipline with market realities. By providing targeted relief without compromising the broader regulatory framework, the regulator helped issuers navigate an uncertain environment and supported the continuity of India’s primary market momentum.
B
Repricing the IPO Boom: When Investor Appetite Sets the Terms
One of the most notable trends among companies listed in Q3 2026 has been the significant downsizing of IPOs relative to the issue sizes envisaged in their Draft Red Herring Prospectuses (DRHPs).
55%
of 58 IPOs cut fresh issue size
* Pre-IPO not factored in
20%+
average cut by downsizers
50%
Deepest single cut
20 Retained
6 Increase
Our analysis of the fresh issue component of the 58 IPOs that included a fresh issue reveals that 32 companies, representing over 50% of the sample, reduced their fresh issue size by the time of listing. While 20 companies retained their originally proposed issue size, only six increased it. The average reduction among companies that downsized their issues exceeded 20%, with some companies reducing their proposed fresh issue size by as much as 50%.
This trend points toward a potential recalibration of valuations in response to evolving market conditions. During the subdued secondary-market environment of 2026, investors were increasingly likely to benchmark IPO valuations against prevailing market multiples rather than the valuation levels commanded by listed peers in 2024 and 2025. Consequently, investor roadshows became a critical reality check, bringing one fundamental question to the forefront:
Are the proposed IPO valuations aligned with prevailing market realities?
THE ANSWER: ISSUERS RESET, INVESTORS GAINED
Issuers recalibrated
Instead of keeping the original issue size and valuation expectations, companies reset their offerings to meet investor expectations.
A pragmatic shift: market acceptance over earlier valuation ambitions.
Investors got better entry points
The reset has led to stronger listing and post-listing performance for companies entering the market in 2026, with a better reception and subsequent price performance.
C
Listing Gains and Beyond: The Returns Tell the Story
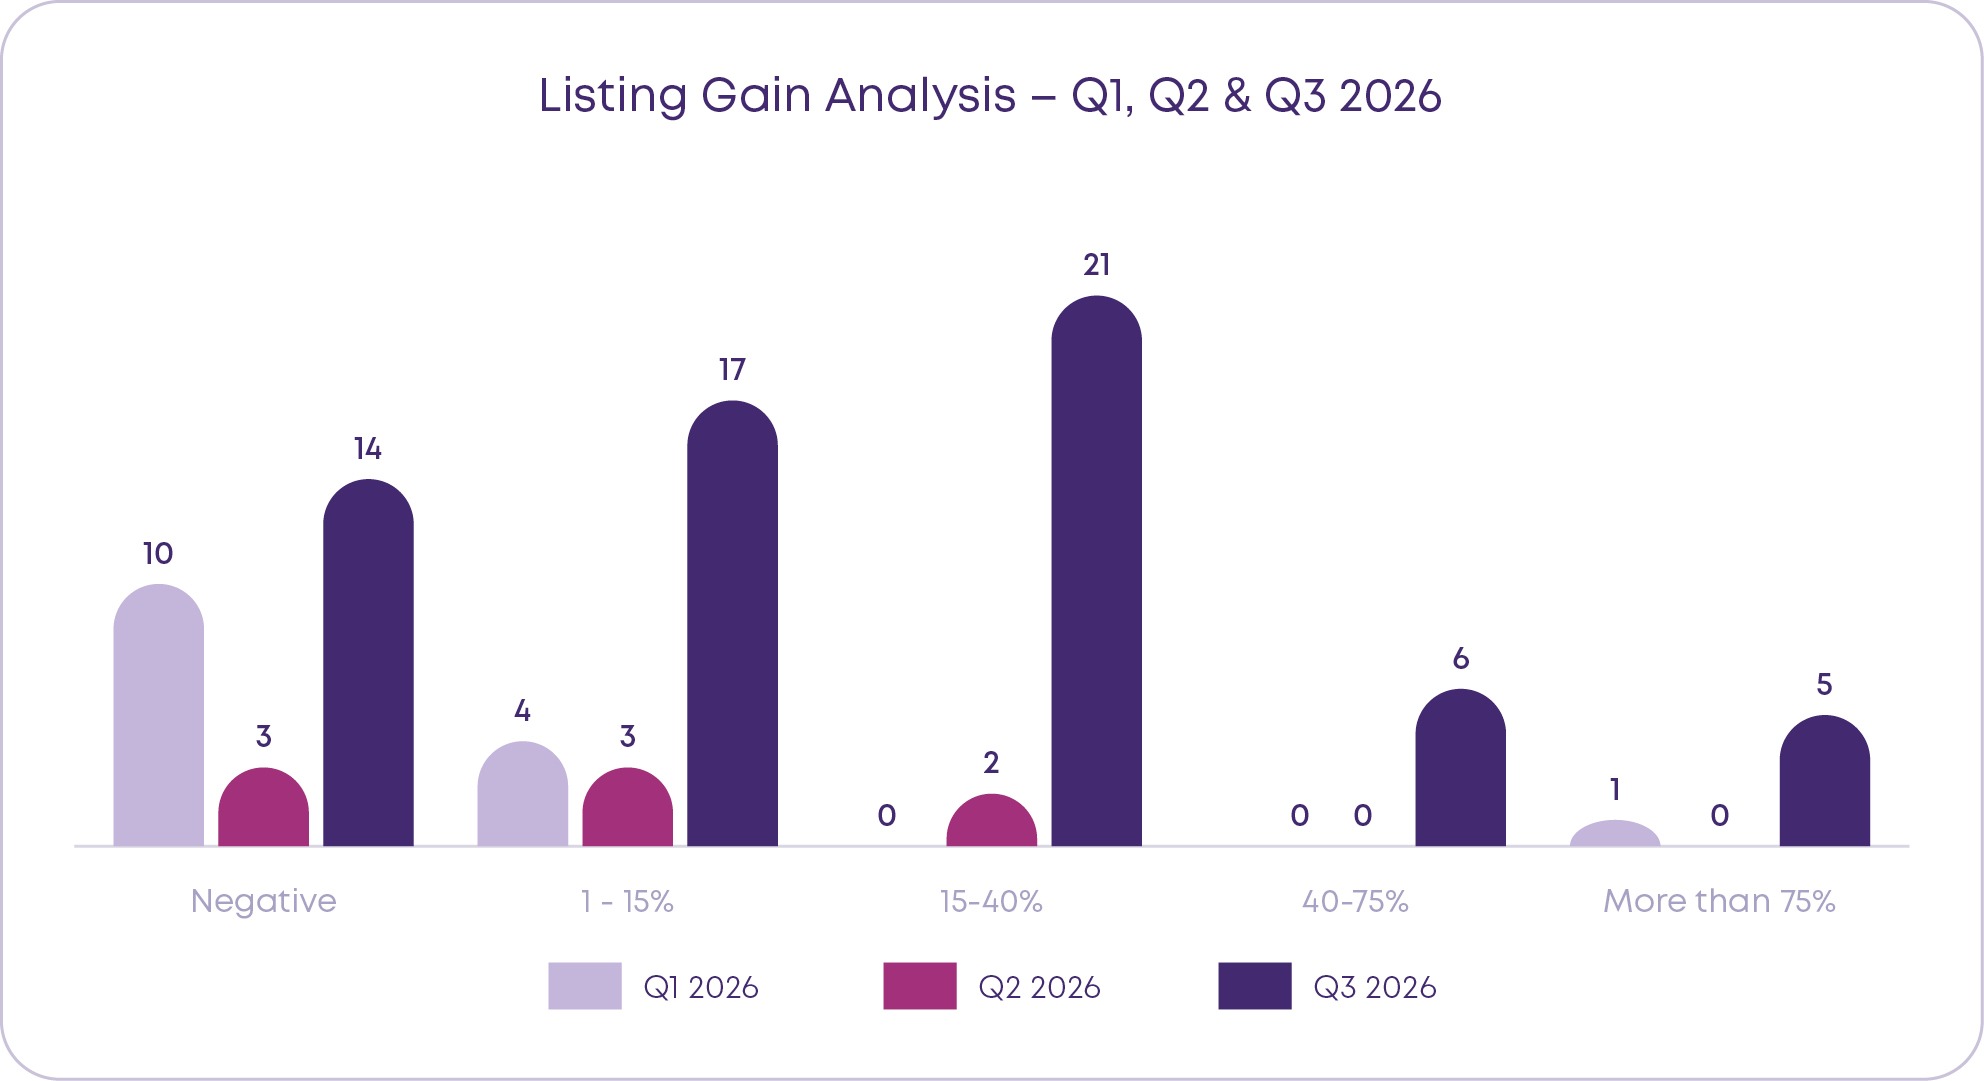
Q1 2026
-1.44% avg listing gain
10+ of 15 listings closed negative
Q2 2026
7% avg listing gain
8 listings, 3 with negative returns
Q3 2026
~20% avg listing gain
49 of 63 listings positive (78%)
Q3 RECOVERY: A GOOD RETURN PERIOD FOR INVESTORS
5 listings jumped over 75% on day one
Few companies like Milky Mist hit a trading freeze within minutes of listing, with no sellers in the market
While listing gains were encouraging, the momentum did not end on listing day. Several recently listed companies continued to deliver healthy post-listing returns, indicating sustained investor interest beyond their initial market debut.
The Rally Continues Beyond Listing Day
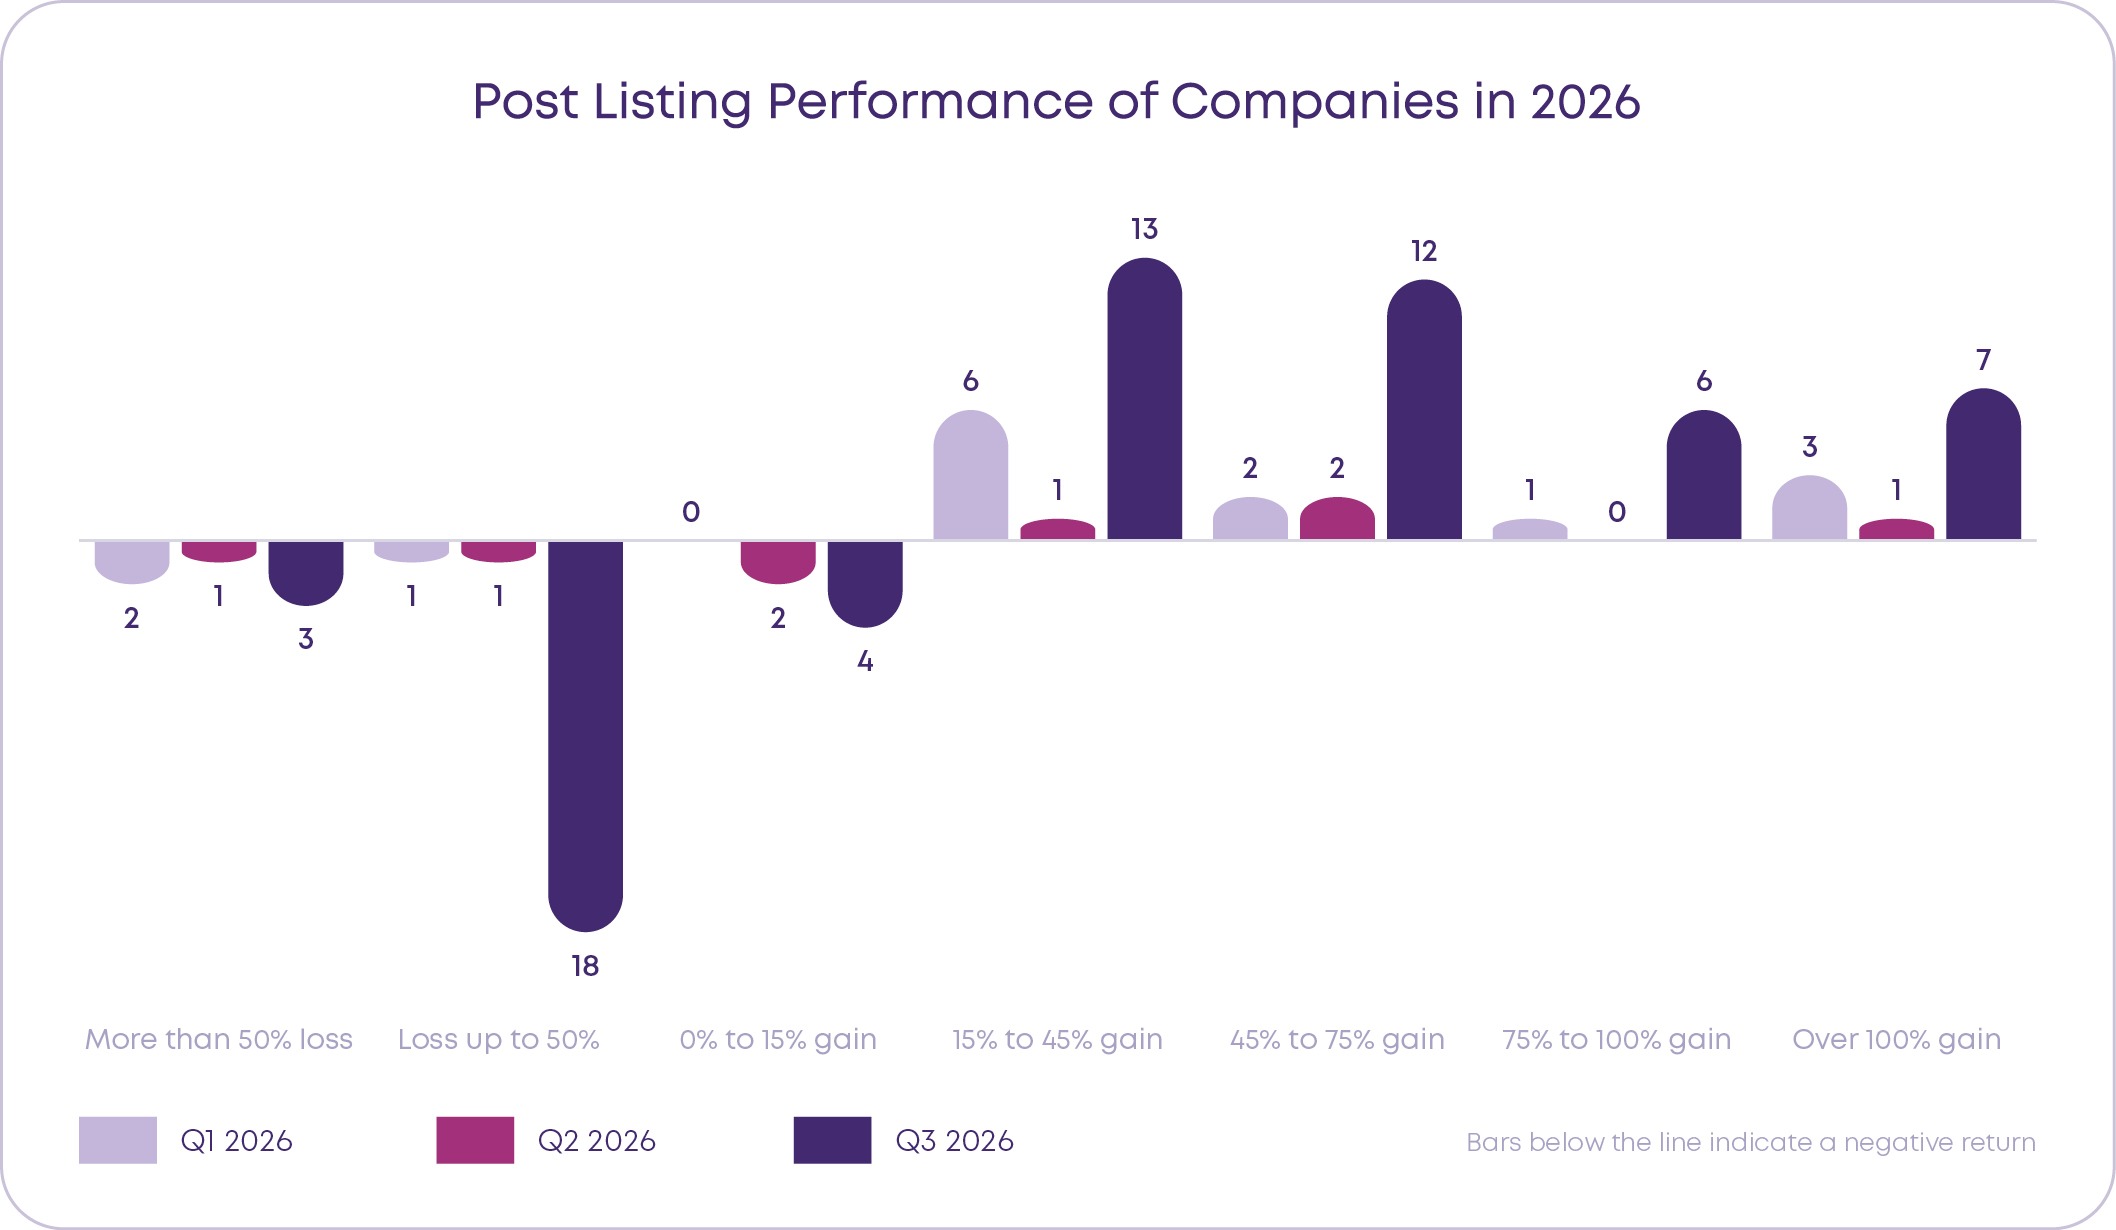
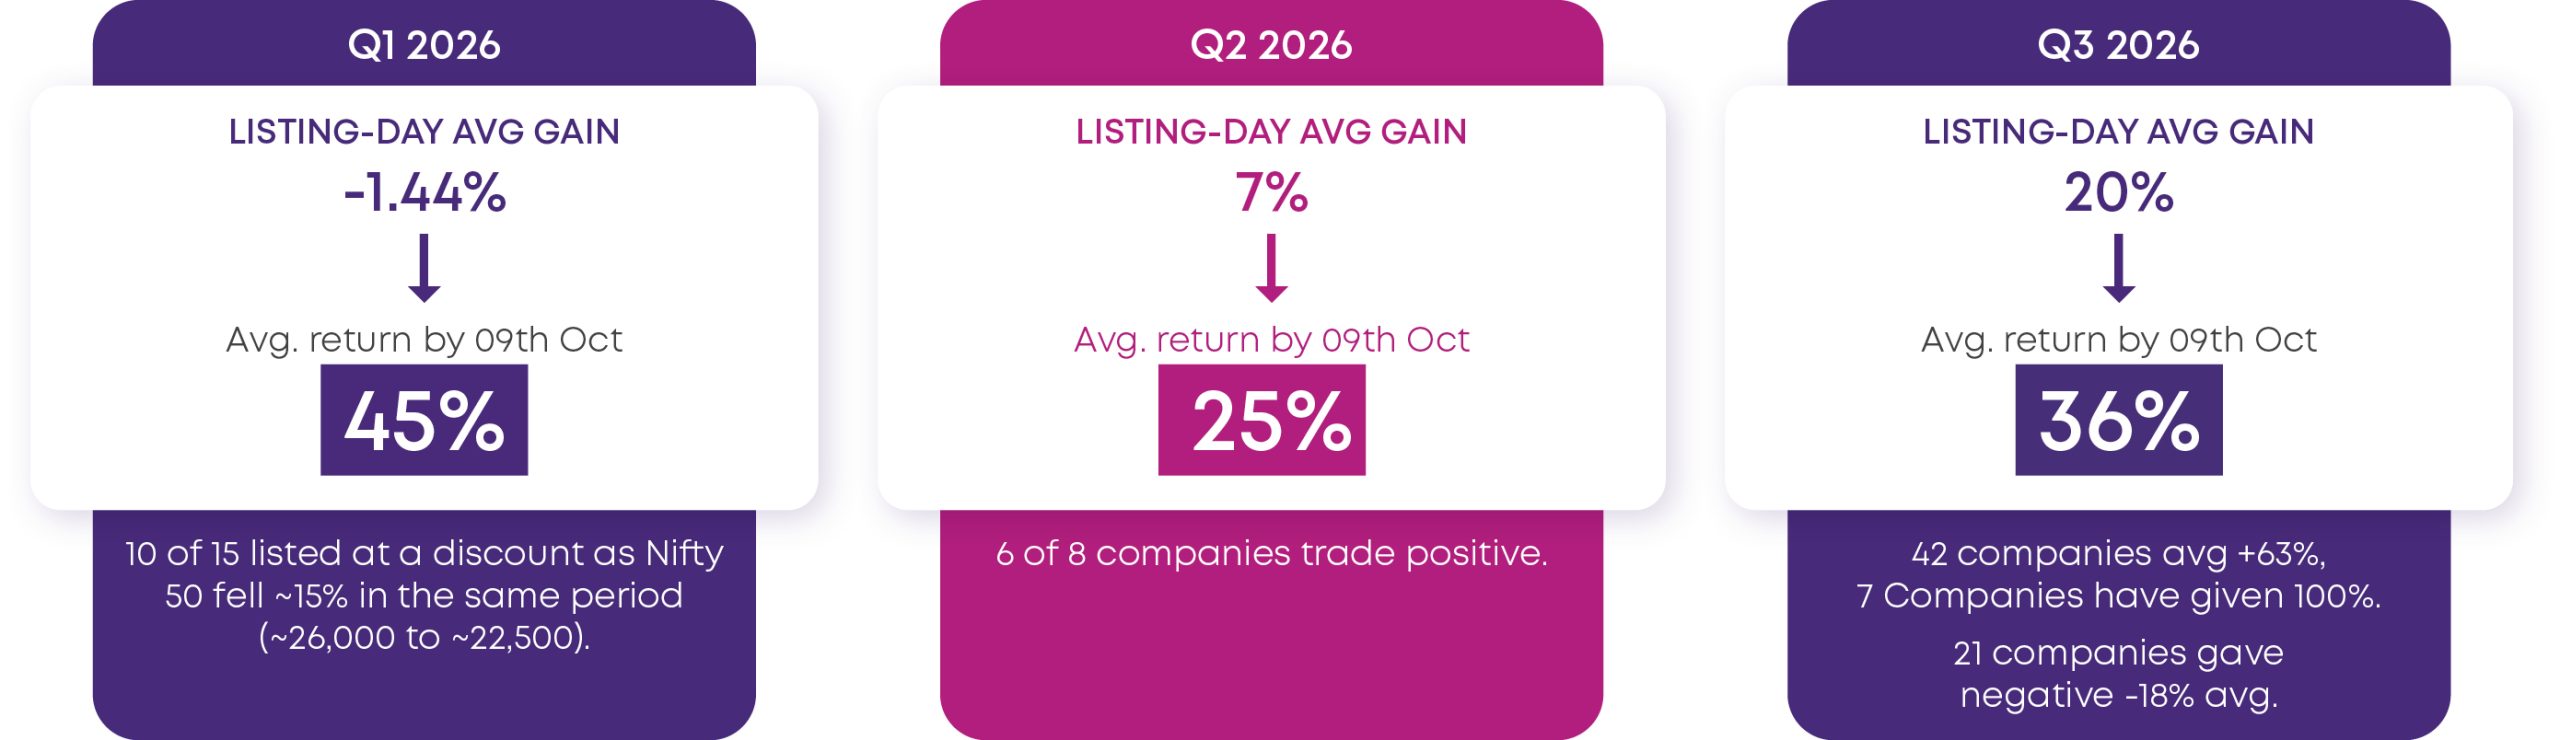
Up-trend continues across all 3 quarters
Average returns rose from listing day to today in every quarter: Q1 from -1.44% to 45% while Nifty 50 fell about 15%, Q2 from 7% to 25%, Q3 from 20% to 36%.
37%
2026 FULL-YEAR AVG RETURN
As of 09th Oct
IPO Insights
Summary: Year 2026 and Q3 2026 at a Glance
| number of listings | Primary issue (Cr) | Offer for sale (Cr) | Overall issue size (Cr) | Avg issue size (Cr) | Avg listing gain | |
|---|---|---|---|---|---|---|
| YEAR 2026 | 86 | 43,330 | 65,856 | 109,186 | 1,270 | 15% |
| Q3 2026 | 63 | 33,841 | 53,839 | 87,680 | 1,392 | 20% |
RECORDS SET IN Q3 2026
63
listings in a quarter
Q3 2026
32
listings in a month
September 2026
6
listings in a day
17 September 2026
73%
80%
Q3 delivered 73% of the year’s listings and 80% of the funds raised, with a 20% average listing gain against 15% for the year to date.
Year 2026 at a glance
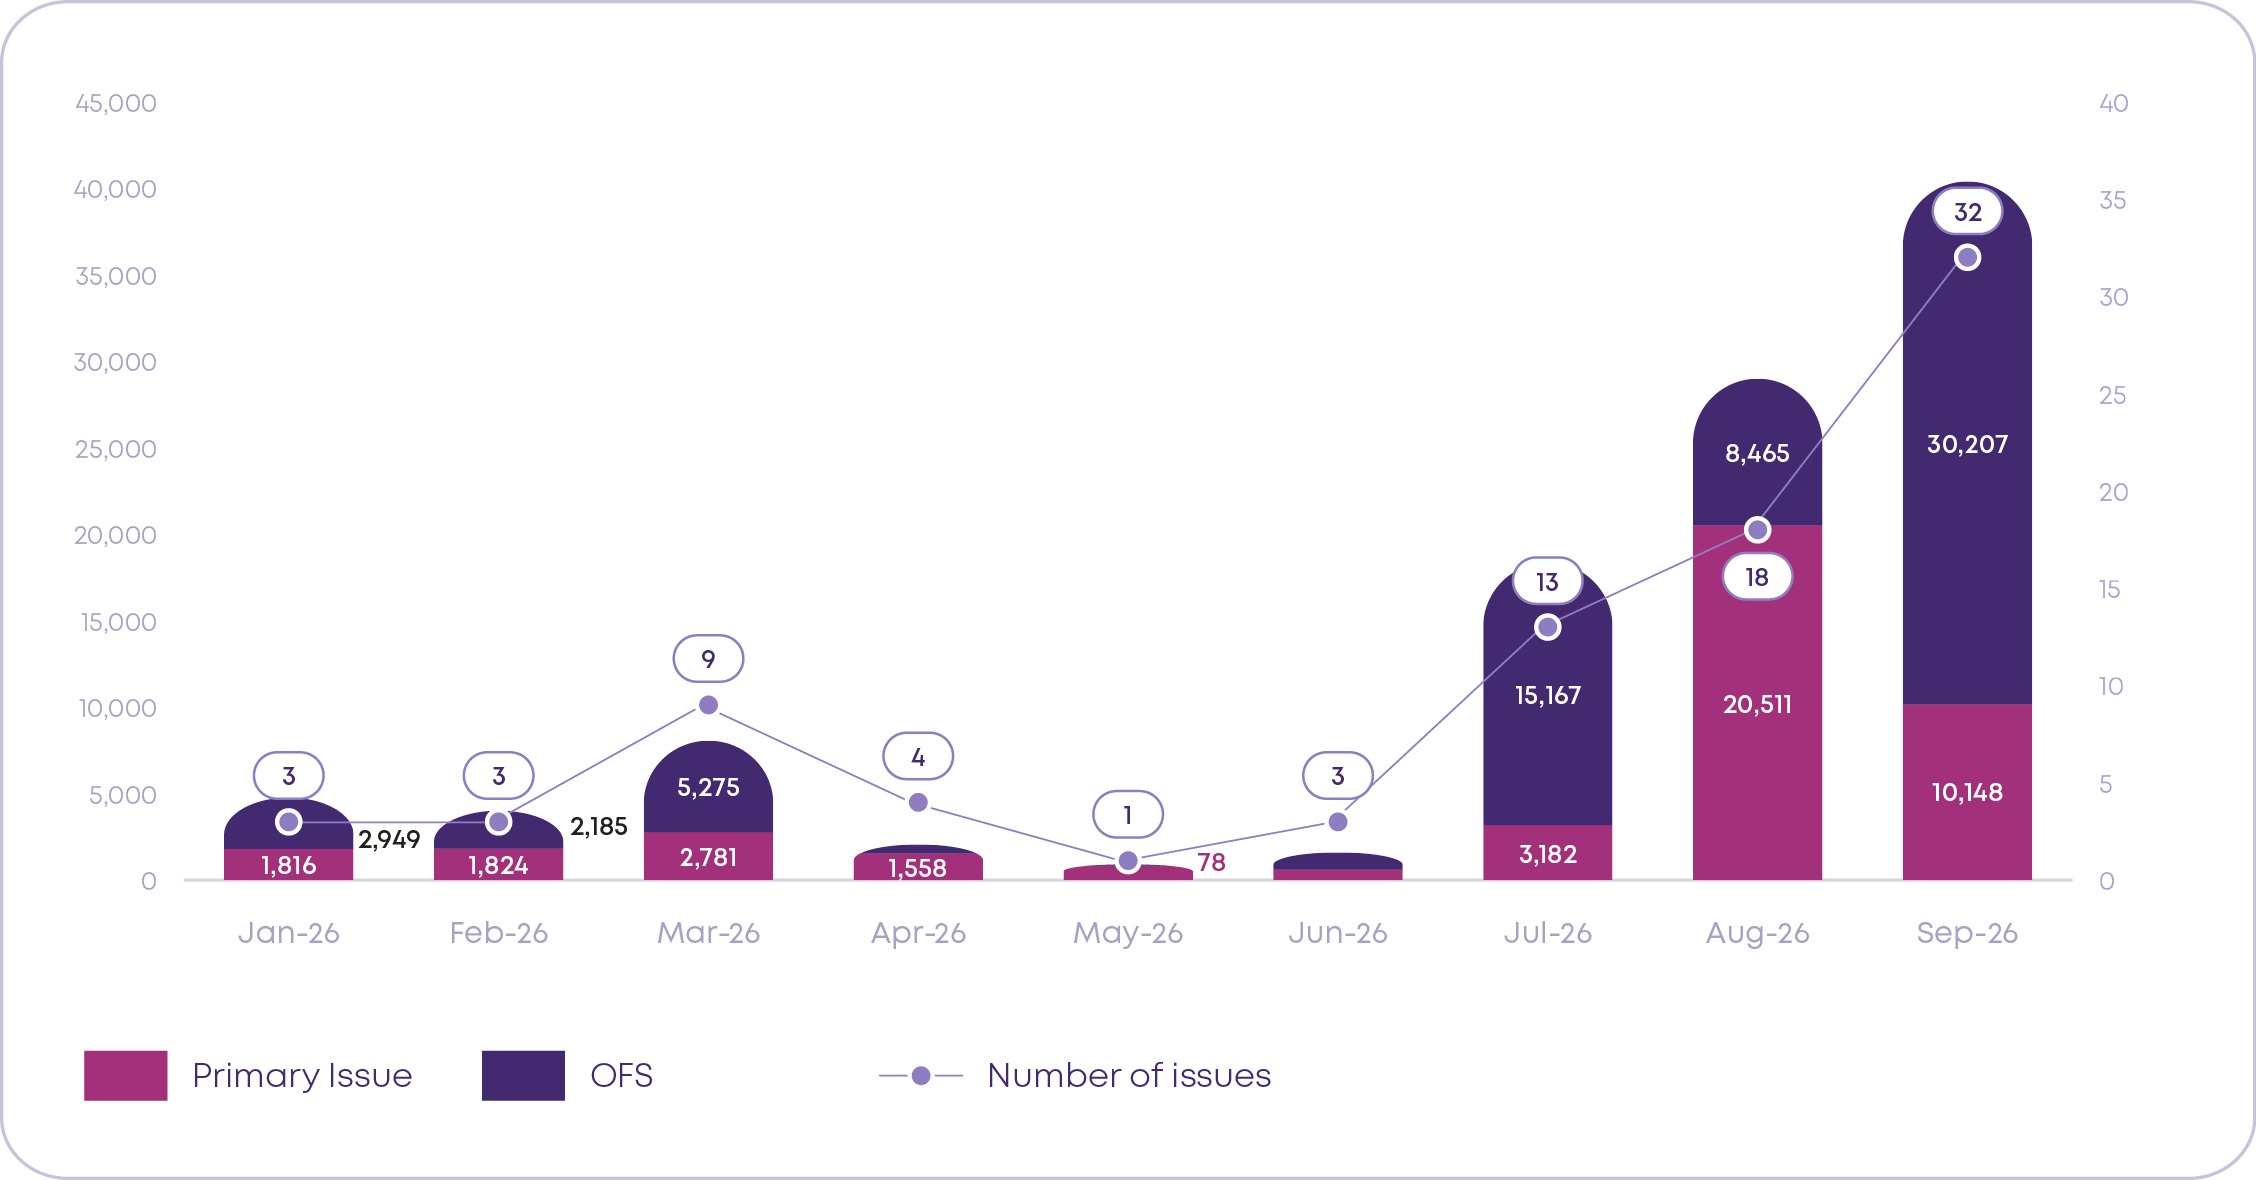
15
listings in Q1 2026
INR 16,830 cr raised
8
listings in Q2 2026
INR 4,677 cr raised
63
listings in Q3 2026
INR 87,680 cr raised
60%+
of Q3 issue size was OFS, in line with the regular trend of OFS outweighing primary issue.
~32,356 Cr
INR crores from the NSE and SBI offerings, both fully OFS. Excluding them, primary would be about 60%.
Smaller Issues Kept Q3 Value Below Record Levels
41,632 Cr
From 3 listings: NSE, Manipal and SBI Funds
67,554 Cr
From the remaining 60 companies
1,270 Cr
Average issue size in 2026.
814 Cr excluding the top 3
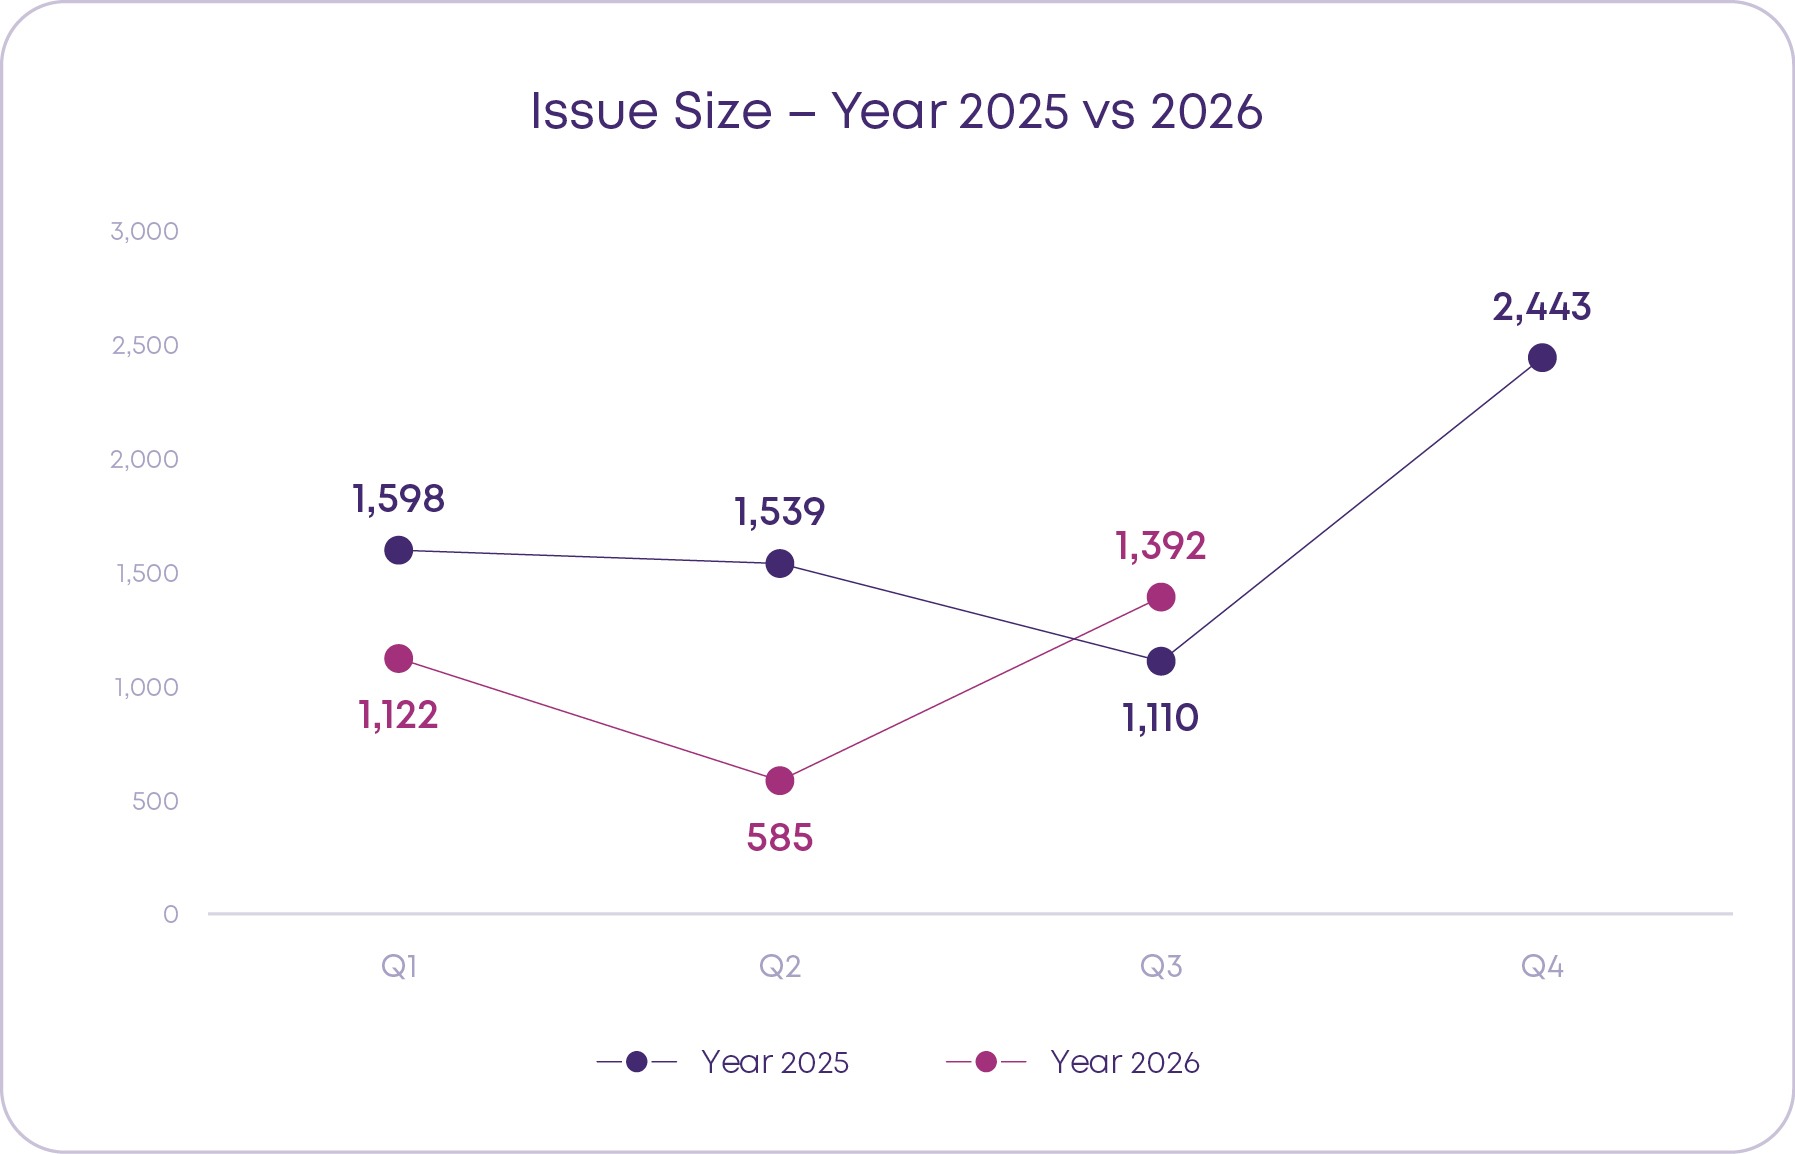
Q4 HAS BEEN THE BIGGEST QUARTER BEFORE
95,524 Cr
Raised in Q4 2024
95,276 Cr
Raised in Q4 2025
Q4 2026 pipeline of large issues : Reliance Jio, Zetwerk, Razorpay, Cult.fit among other issuers
Q4 of 2026 may end of matching the issue size and value of the last 2 years.
Closer Look: Use of Proceeds
IPO Proceeds: Deleveraging Takes Priority Over Expansion
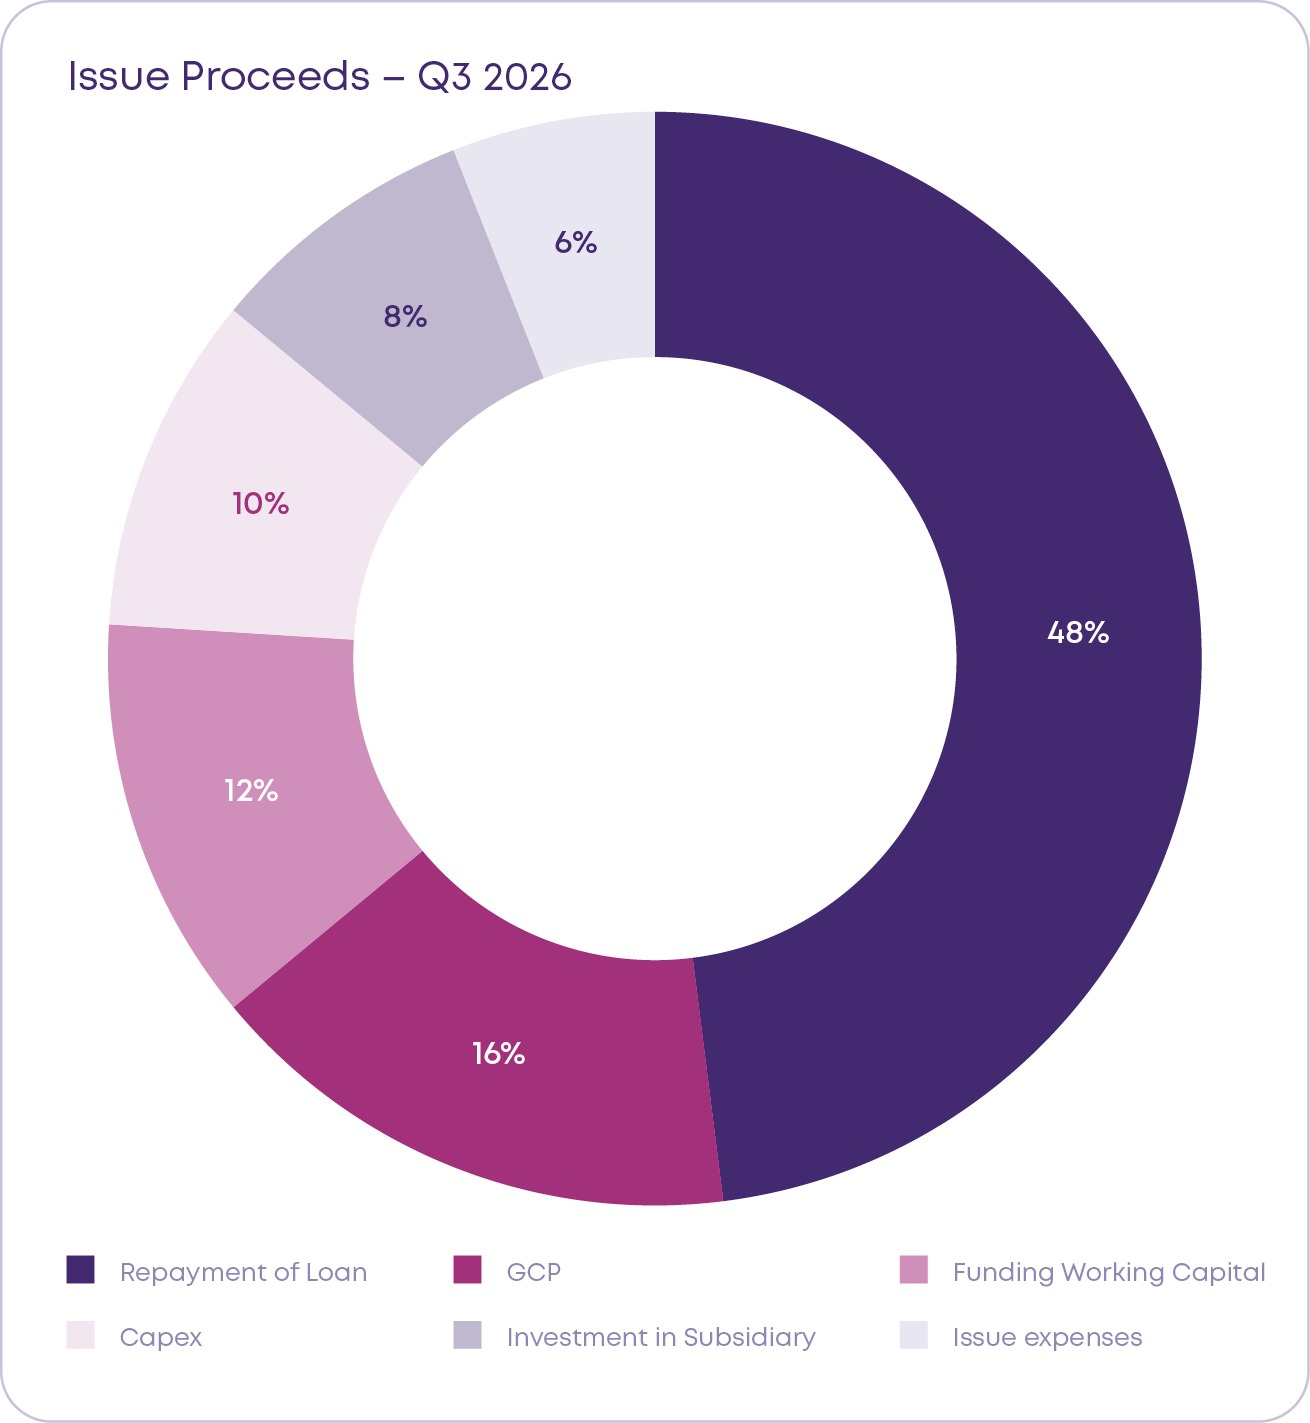
48%
of Q3 2026 proceeds went to repaying or prepaying borrowings, higher than regular trends
16%
General corporate purposes: the second-largest use of proceeds.
12%
Working capital: held down because the NSE and SBI offerings were entirely OFS.
10%
Capex: many issuers cite it, but mostly small-ticket projects, not major expansions.
Q3 2026 proceeds went towards deleveraging, stronger balance sheets and financial flexibility, not just growth.
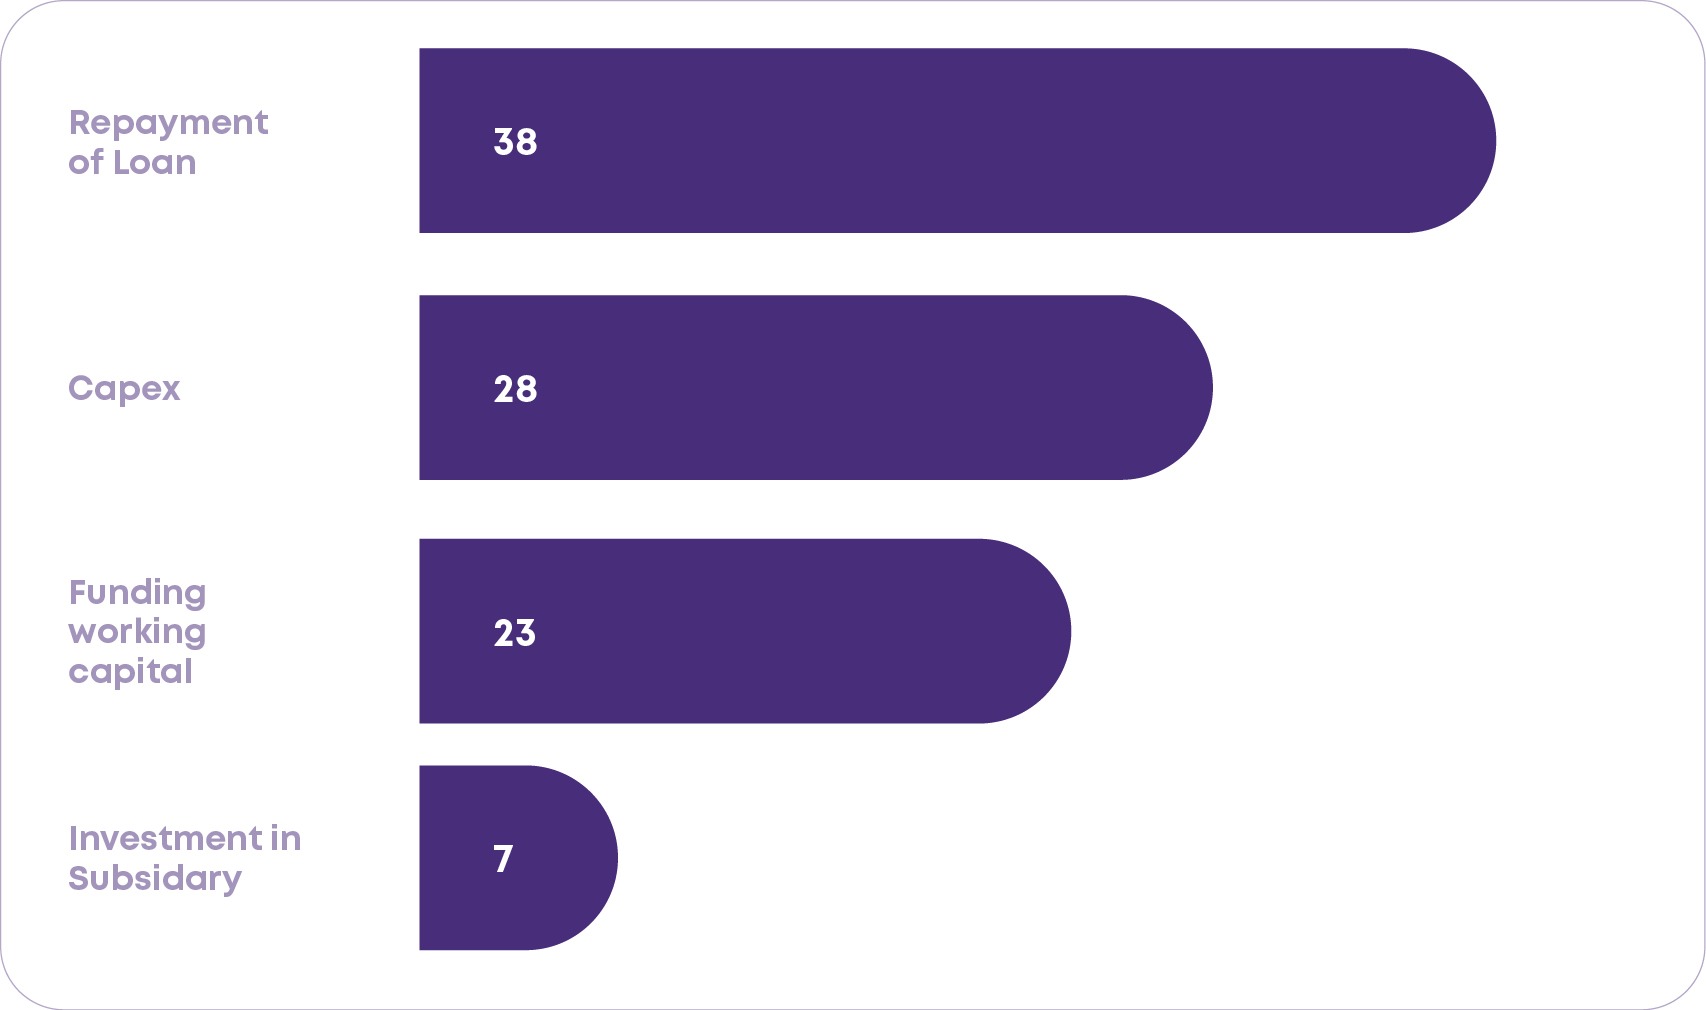
Debt repayment leads, capex trails
Repayment of loans is the most common objective at 38, ahead of capex at 28 and working capital at 23.
While capex is a common IPO objective, it accounts for only around 10% of proceeds, indicating relatively modest investment plans across issuers.
Key Insights
Subscriptions Rebound from June 2026
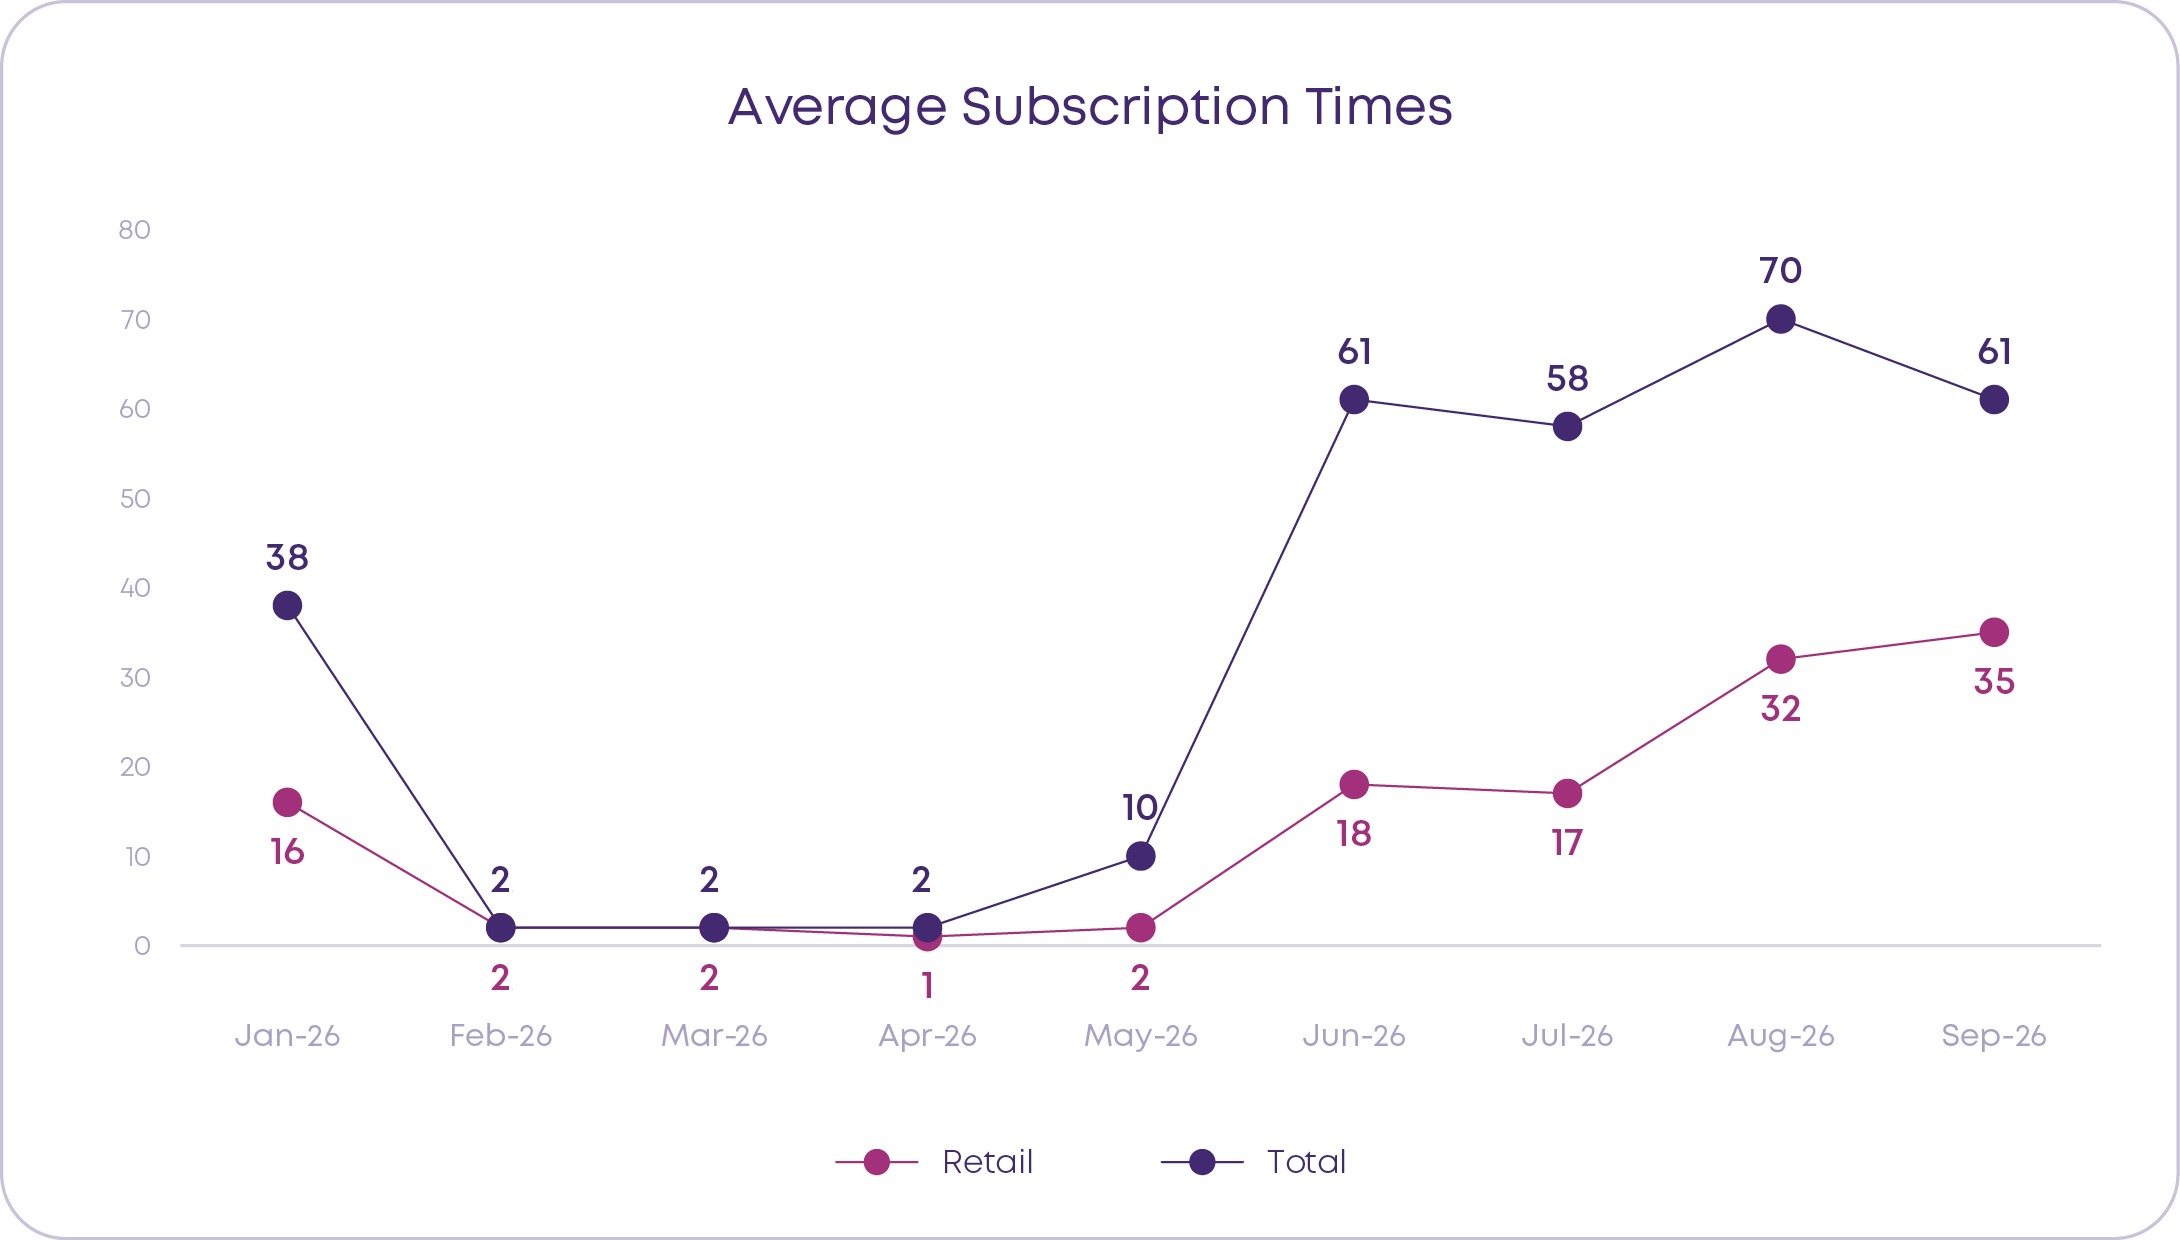
~60x
overall subscription each month, Jun to Sep 2026
35x
retail in Sep 2026, up from 18x in Jun
~20%
average Q3 listing gain
| Average Subscription (Times) | ||||
|---|---|---|---|---|
| Months | QIB | NII | Retail | Total |
| Jan-26 | 61 | 77 | 16 | 38 |
| Feb-26 | 1 | 0.34 | 2 | 2 |
| Mar-26 | 2 | 6 | 2 | 2 |
| Apr-26 | 3 | 6 | 1 | 2 |
| May-26 | 25 | 7 | 2 | 10 |
| Jun-26 | 97 | 111 | 18 | 61 |
| Jul-26 | 101 | 97 | 17 | 58 |
| Aug-26 | 113 | 104 | 32 | 70 |
| Sep-26 | 84 | 93 | 35 | 61 |
QIBs
84x Sep 2026 average, despite 32 listings in the month
On a roll since May: June to September subscriptions have been spectacular after a period of limited activity from February.
NIIs
500x Advait saw 500x from NIIs, which is a rare event
Moved in tandem with QIBs; Jun 2026 average was ~111x.
Overall: Q3 subscription ran far above earlier months and carried through to listing gains, with Q3 listing gain averaging ~20%.
Sectoral IPO Landscape – Q3 2026
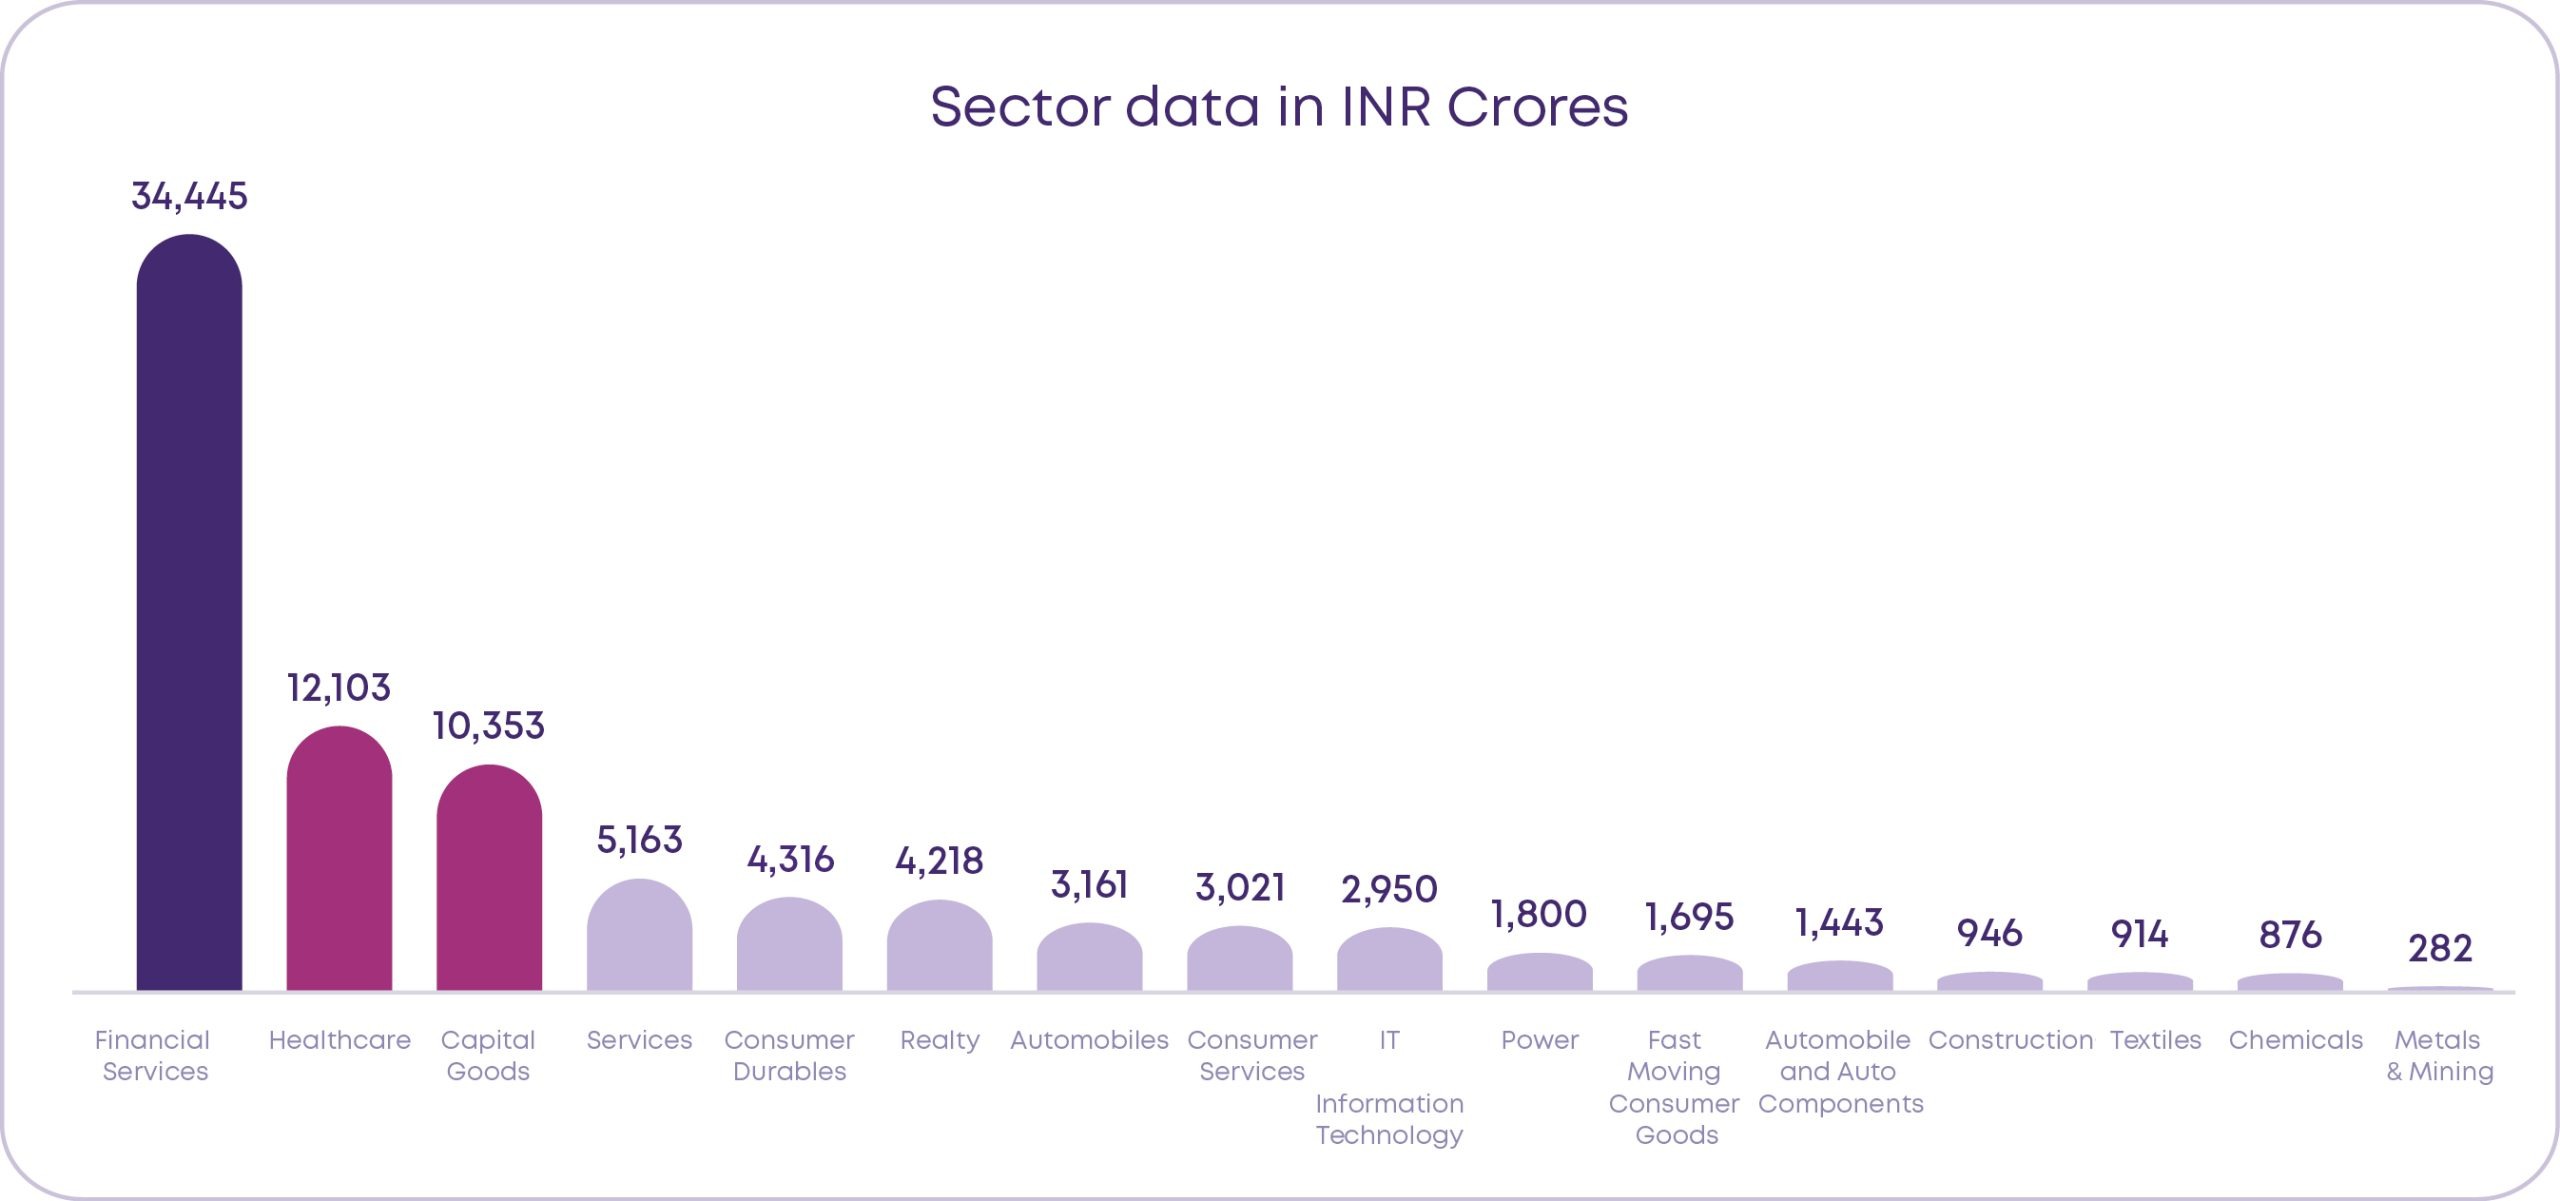
FINANCIAL SERVICES
~40%
Largest sector by funds raised, INR 34,445 crores. The NSE and SBI offerings were 100% OFS, nearly INR 32,000 crores in total.
HEALTHCARE
12,097
INR crores. Led by Manipal; 4 listings in the segment.
CAPITAL GOODS
13
listings, the highest of any segment, mostly small-ticket issues.
SERVICES AND DURABLES
3 Services INR 5,163 cr
7 Consumer durables INR 4,316 cr
IPO Journey – A synopsis
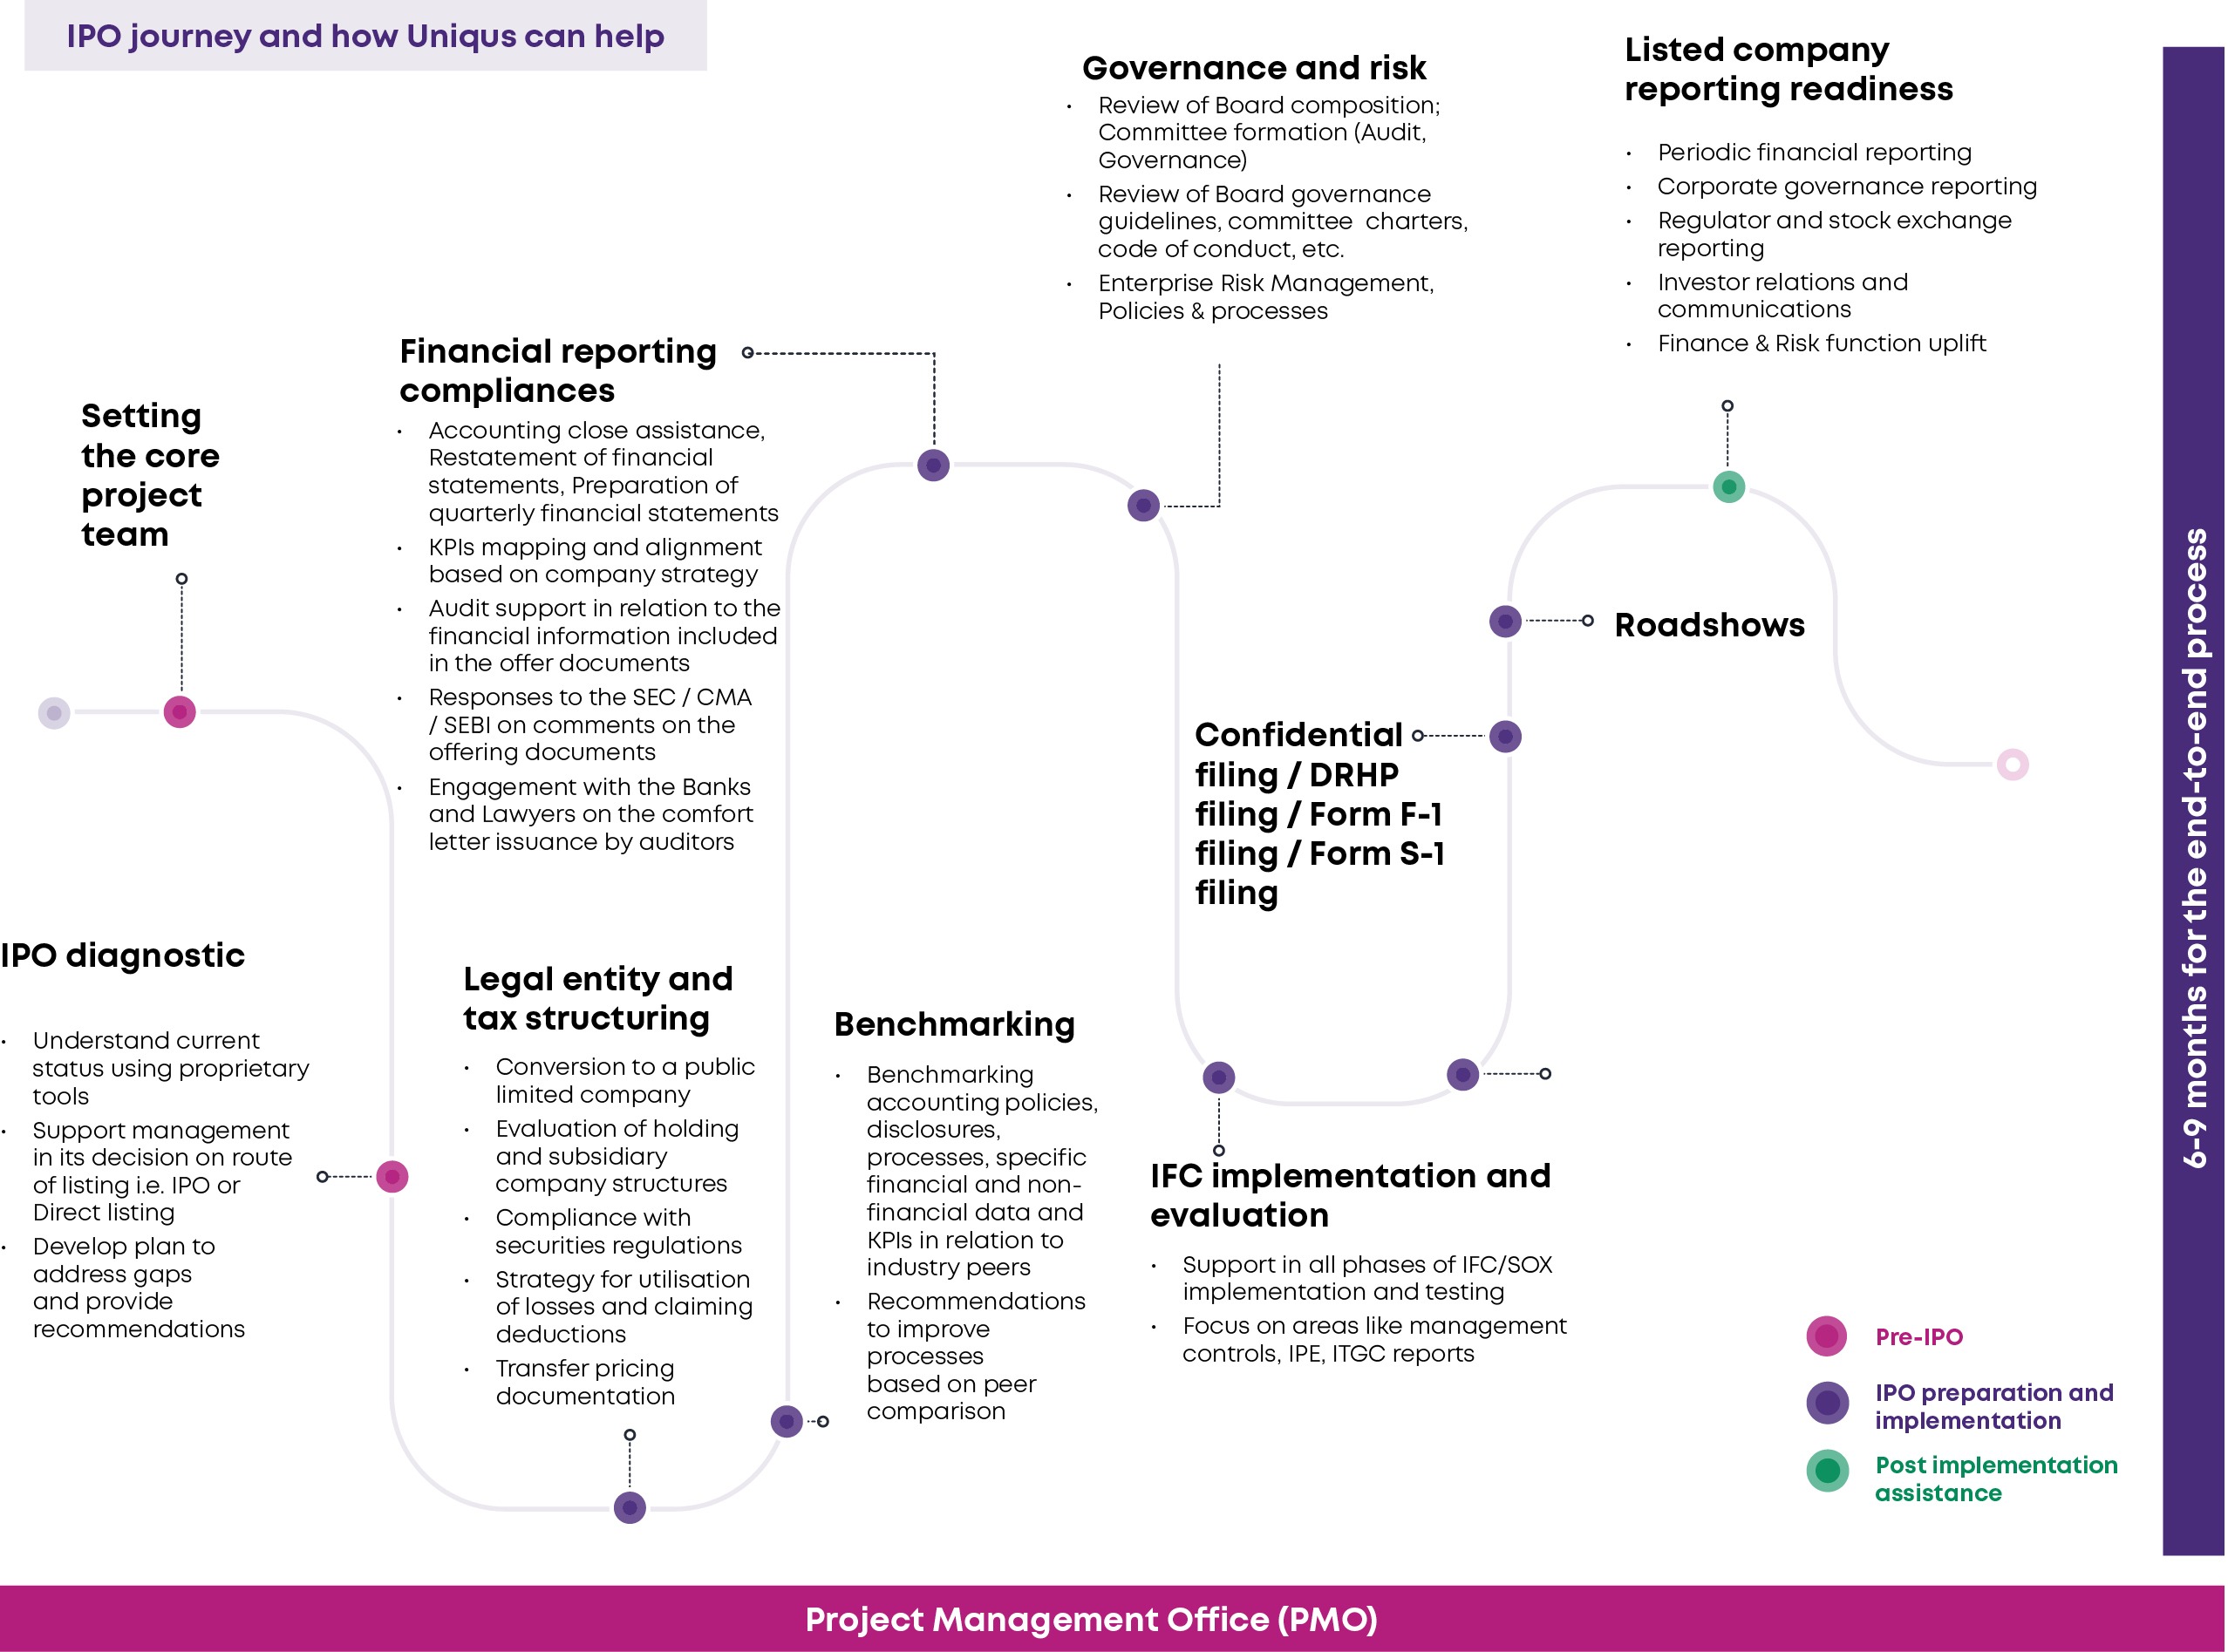
Focus on Our IPO Enablers