India IPO Story 2024 at Global Stage
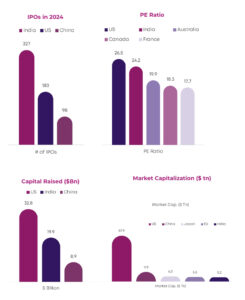 The year 2024 witnessed significant activity in the global IPO market, with India emerging as a standout performer. Leading the world in the number of IPOs, India hosted 327 listings, surpassing the USA and China, which recorded 183 and 98 IPOs, respectively. This remarkable achievement highlights India’s robust equity market, fueled increased domestic participation.
A key driver of this momentum is India’s competitive valuation landscape. Indian markets are currently offering a PE multiple of 24.2, second only to the US, which leads with a PE multiple of 26.5 among the top 10 developed and emerging economies.
In terms of capital raised, India secured the 2nd position globally, raising approximately USD 20 billion through IPOs. The USA, with its well-established equity markets, maintained the top spot, raising USD 33 billion. The strong capital-raising performance by Indian companies underscores the growing depth and maturity of its capital markets.
When it comes to IPO returns, India continued to shine with average IPO returns1 of 30% from main board listing and a 60% average return driven by SME listings, placing it among top performers globally.
Further cementing its global standing, India’s National Stock Exchange (NSE) retained its position as the 5th largest stock exchange in the world by market capitalization. This achievement reflects the strong performance of listed companies and growing market participation.
Overall, India’s stellar performance in the global IPO market in 2024 highlights the country’s growing role as a key player in global capital markets. The year’s success emphasize the strong investor sentiment, market resilience, and the potential of Indian companies to compete on a global scale.
Average IPO Returns computed as a simple average of listing day gain of each issuer on the mainboard and SME exchanges
Indian economy to its global peers
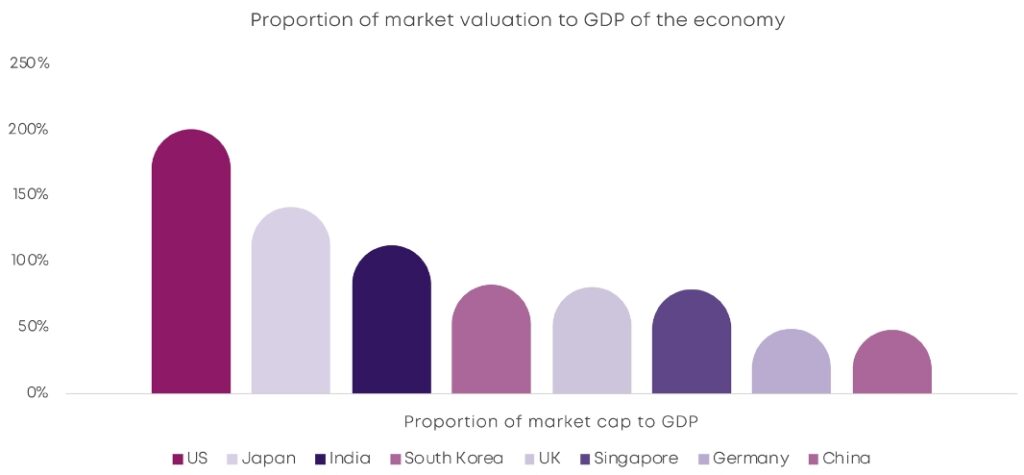
India’s market cap-to-GDP ratio, also known as the Buffett Indicator, stands at 112%, positioning it as a balanced and promising equity market. This ratio reflects India’s strong economic fundamentals, including a GDP growth rate of 6-7%, ongoing structural reforms, and sectoral diversity.
Comparatively, The United States with 200% ratio, which is higher than most other economies, potentially reflects the mature and tech-heavy market. In contrast, China, with a ratio of just 48%, highlights structural challenges, and a limited equity market relative to its economic size. India’s market is well-positioned to attract both domestic and global investors, offering a balance of growth and valuation. This strong relative position makes India a standout among emerging markets and a compelling investment destination in the global landscape.
Foreign participation in Indian market:
Upon analyzing the activity of Foreign Institutional Investors (FIIs) in the secondary market, it was noted that FIIs sold INR 3.04 lakh crore (USD 35.53 billion) in 2024, reducing the total holdings in the Indian equity market to a record low in over a decade to 16%. However, the secondary market continued to show resilience where it gained 9% in the said period.
Such resilience was due to the fact that Domestic Institutional Investors (DIIs) (via the investment through SIP and direct investment by equity participants in India) continued to buy (INR 5.27 lakh crores) despite the negative sentiments cause by FII selling.
Considering the attractiveness of the Indian market as against the global peers as highlighted in our previous editions and potential increase in the participation by the retail investors, we can see the trend of good performance in the upcoming years in the Indian market and is expected to continue as we have seen in the year 2024.
Listing on Main-Board
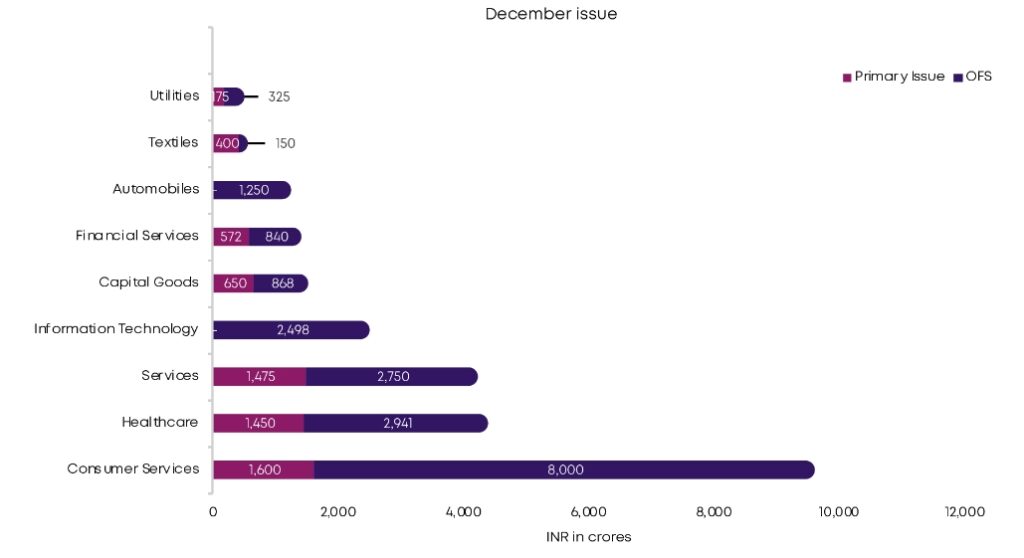
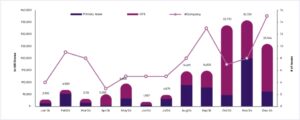 The IPO activity in 2024 showcased significant trends across quarters, with a clear surge in momentum as the year progressed. Q4 emerged as the standout quarter, contributing nearly 60% of the total capital raised (INR 159,446 crores) during the year, with INR 95,444 crore raised across 30 IPOs. This was accompanied by a sharp increase in the average issue size, which peaked at INR 3,181 crore, highlighting the dominance of large-scale IPOs in the final quarter. November alone stood out as the most active month, raising INR 35,729 crore, driven by substantial offers for sale (OFS) at INR 15,663 crore and significant primary issues amounting to INR 20,066 crore contributed by lPOs of Swiggy and NTPC Green. December maintained the momentum, with 15 IPOs raising INR 25,944 crore contributed largely by INR 8,000 crore OFS by Vishal Mega Mart.
The year began on a modest note in Q1, with 21 IPOs raising INR 12,990 crore and an average issue size of INR 619 crore, reflecting smaller offerings during the initial part of the year. Activity picked up slightly in Q2, with 13 IPOs raising INR 16,618 crore, and the average issue size doubled to INR 1,278 crore, primarily driven by notable listings such as Bharti Hexacon, Adhar Housing, and GoDigit Insurance. The market gained significant momentum in Q3, with 26 IPOs raising INR 34,394 crore, supported by high-profile listings like Ola Electric, FirstCry, and Bajaj Housing, which together contributed approximately 50% of the quarter’s total proceeds. The average issue size further increased to INR 1,323 crore, underscoring a mix of mid-sized and larger IPOs, with strong contributions from both primary issues and OFS.
A key feature of the year was the dominance of OFS in driving total proceeds, particularly in Q4, where
INR 64,239 crore (67% of the quarter’s total) came from OFS, indicating that existing stakeholders leveraged favorable market conditions to divest their holdings. Primary issues also played a significant role throughout the year, peaking in November with INR 20,066 crore raised. The increasing average issue sizes from INR 619 crore in Q1 to INR 3,181 crore in Q4 further underscore the growing scale of IPOs, reflecting strong market sentiment and confidence among issuers.
Overall, 2024 was a transformative year for the IPO market, marked by a gradual build-up in activity
and culminating in a stellar performance in the final quarter. The year highlighted the resilience and attractiveness of the IPO market, with strong participation from institutional and retail investors alike, and a clear trend toward larger, high-value issues that capitalized on favorable market conditions.
Listing in Pipeline with SEBI
As of today, SEBI has received approximately 106 draft offer documents, which collectively represented a proposed issue size of around INR 112,400 crores (approximately USD 13.2 billion).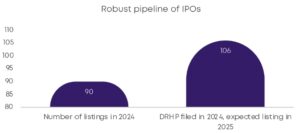
December month saw close to 30 DRHPs filed from the companies.
While 2024 registered a stellar growth in terms of capital raised and number of listings, it is expected that the trend is expected to continue in the near future in 2025 considering the amount of IPOs already in pipeline. Some of the companies that have filed DRHP include HDB Financial Services Limited, Hexaware Technologies Limited, JSW Cement Limited, etc.
Investor Participation
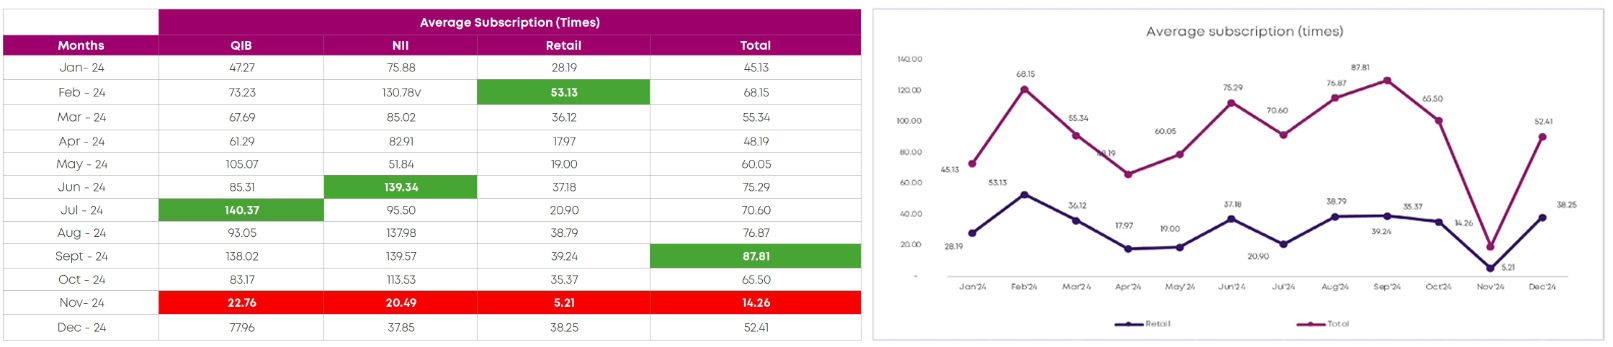
The subscription levels in December 2024 exhibit a bounce back after a significant decline across all investor categories in the November month reflecting improved market sentiment towards the end the of the year.
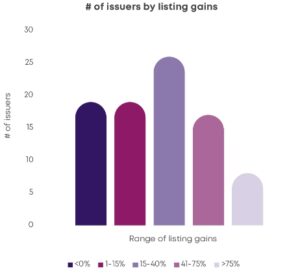 Between January and December 2024, the IPO market in India experienced significant momentum, with many listings delivering robust listing gains. This period was marked by investor optimism fuelled with stable macroeconomic conditions and a buoyant secondary market. With almost 73% of issuers achieving gains of more than 15% and an average listing gain for the period January to December 2024 of 30%, the environment continue to be conducive for successful IPOs. The performance underlines the importance of timing, strong fundamentals, and favourable market conditions in achieving high IPO listing gain.
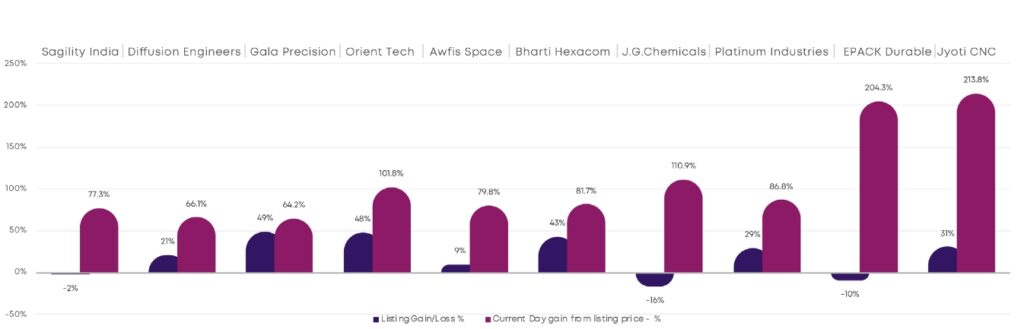
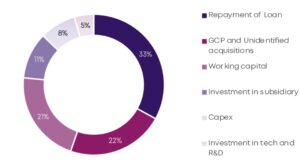
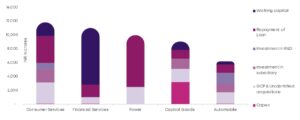 In 2024, the utilization of IPO proceeds across the top five industries highlighted varied priorities, with loan repayment emerging as the predominant use of funds, accounting for significant allocations across most sectors. The consumer services sector directed 32.9% of its proceeds to loan repayment (₹3,892 crore), followed by 25.8% to general corporate purposes & unidentified acquisitions (GCP&UA) (₹3,050 crore) and 16.1% to investments in subsidiaries (₹1,903 crore).